What is Geomodeling?
“So, what do you do for work?”
The inevitable question comes up again and again when meeting new people, either at your friend’s house party, out at the bar, or in the blind date your bestie set you up with because “you’d totally hit it off, I’m sure of it”.
My simple answer would be “I’m a geologist”. Then I’d wait for the conversation to go towards the all familiar road of either that weird rock their kid found the other day, or asking whether I dig for dinosaur bones, or for old cities etc.
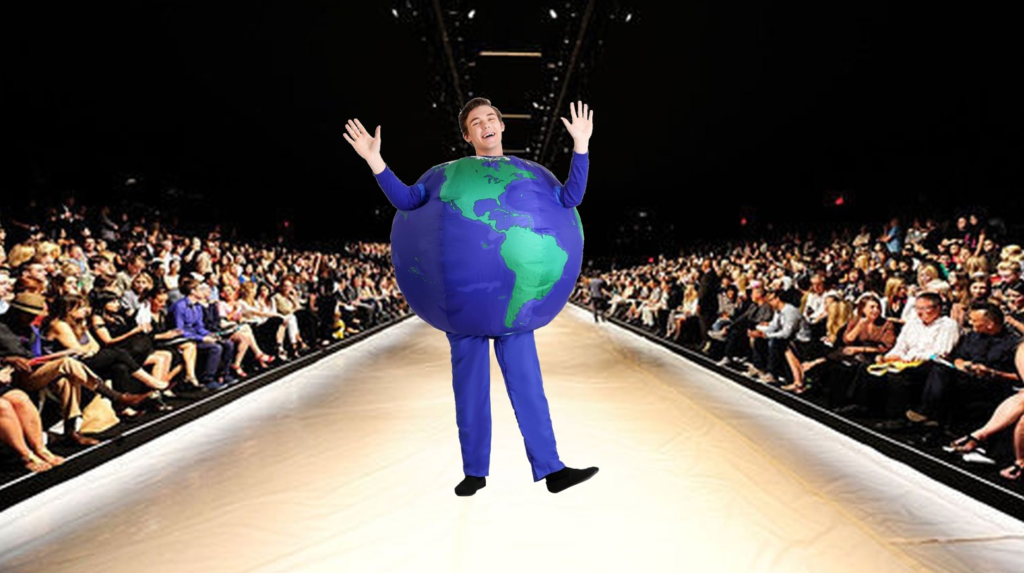
A more precise answer to that question would be, “I’m a geomodeler”; however most anyone outside of the geosciences would have little idea what that means, and I’d be met with blank stares, while the other party processes mental images of me strutting my stuff in some bizarre earth-themed fashion show.
But really- what IS geomodeling?
Geomodeling at its heart, is the process of creating digital representations of the Earth’s subsurface based on measurements and observations, which we use to extract information. These representations are usually fit for purpose, and will capture different aspects of the subsurface, depending on the goals of the project.
Now that’s a pretty loose definition. You might say that a computer generated structural map extrapolated from formation tops is a geomodel:
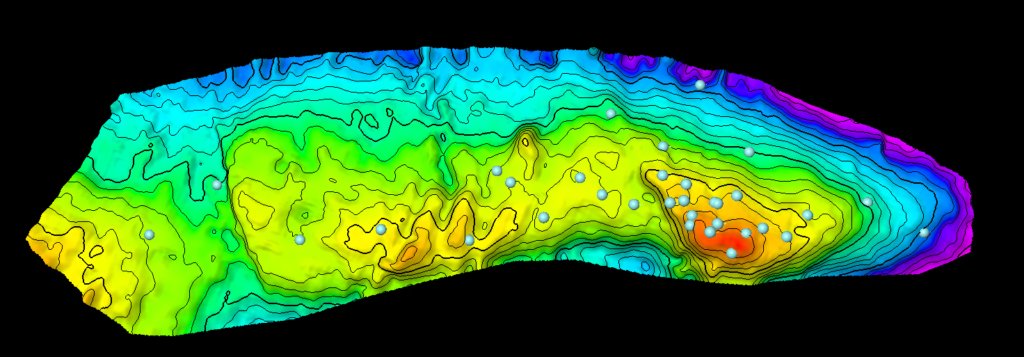
and I would say that you are technically correct! If you have ever used a computer algorithm to generate a structural surface, you are a geomodeler, congratulations!
2D modeling
In particular, a structure contour map is a 2D model of what we expect represents a formation boundary. We use it to make predictions- for example, if you drilled a well, how deep would you expect to drill before you hit the formation? We can use this prediction alongside other data to extract information- for a crude example, approximately how much might it cost to drill down to this formation, given what we know about drilling costs?
Taken by itself, however, it is of fairly limited use, because it only describes the boundary between two rock formations. What if we’re interested in the unit thickness, or the porosity and other rock properties within the unit itself?
Well, let’s just build some more maps- for instance, the base of the formation, the thickness of the formation, and perhaps a porosity map:
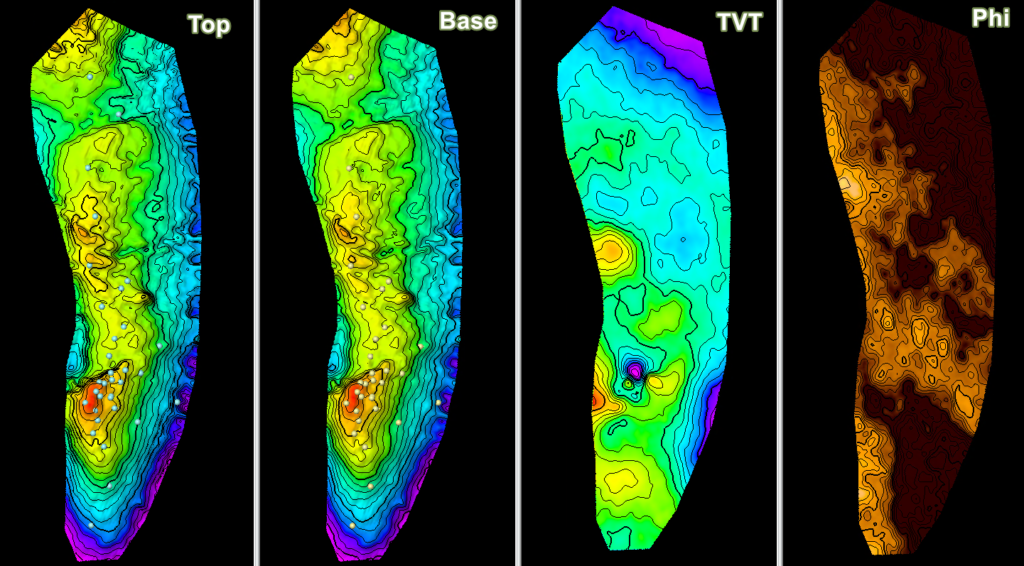
Now, we’re starting to resolve more information about this geologic unit. We can see what areas overall have higher porosity,, or where the formation thins out. We can of course go on to create oil saturation maps, and run some surface calculations to determine the amount of oil in different parts of the unit. Depending on how homogeneous the unit is, 2D mapping can get carry you a long way.
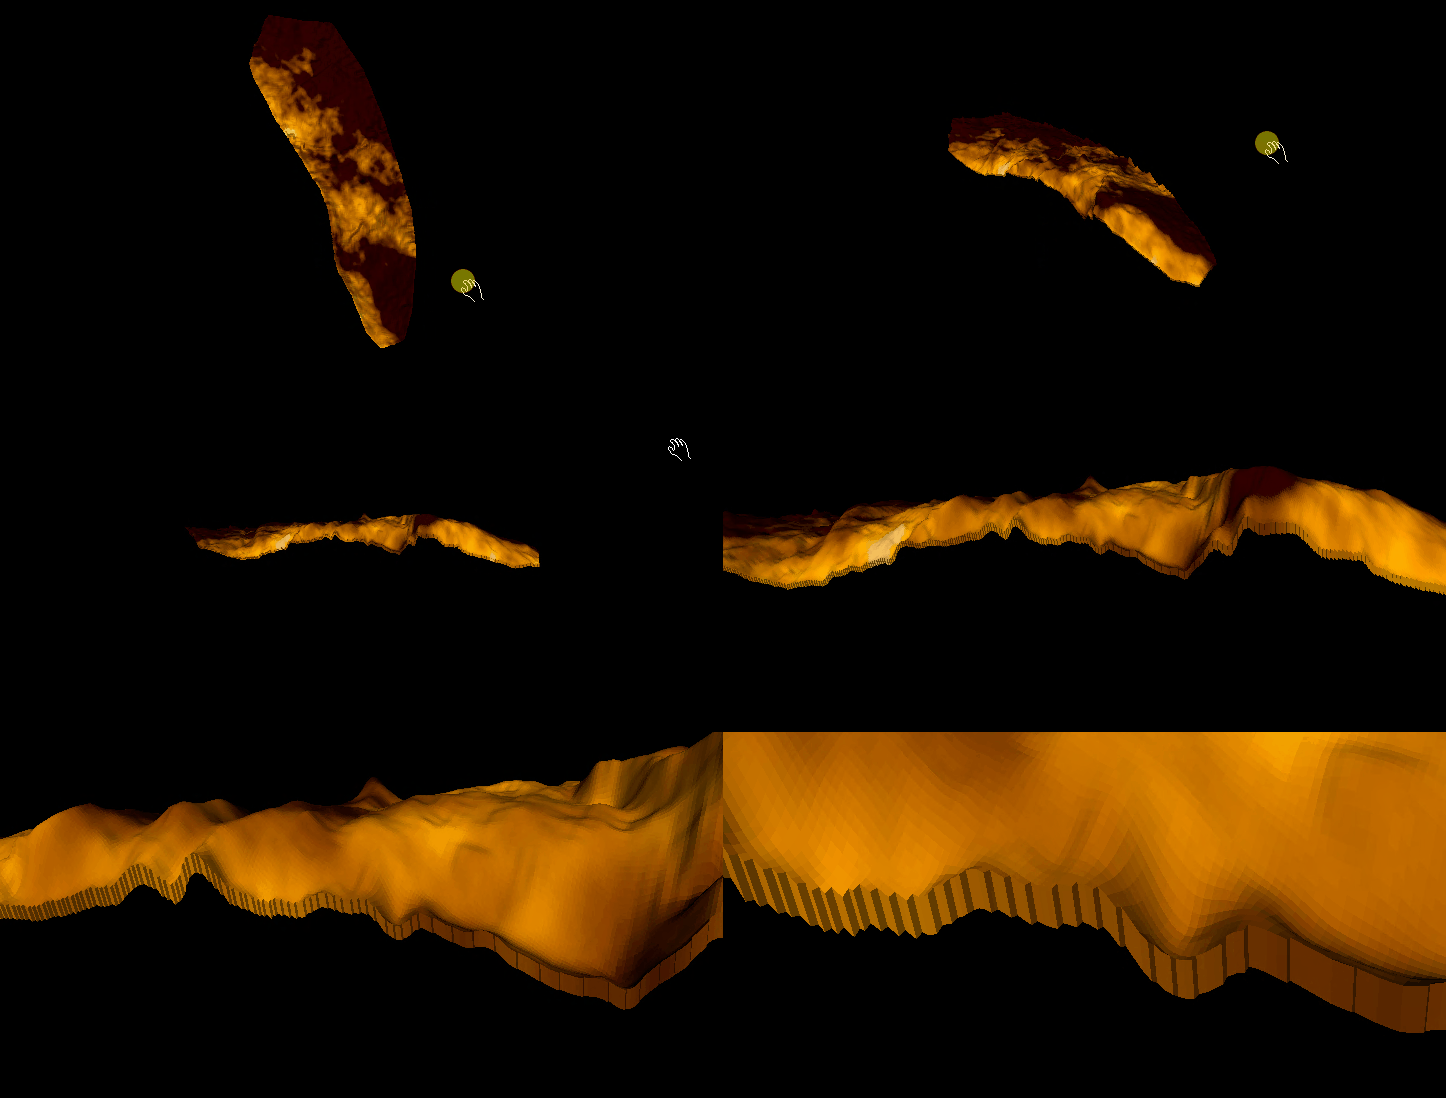
However, let’s take a look at the porosity logs in cross section:

We can see that in general, the bottom and the upper middle sections of the formation have have fairly low porosity when compared to the rest. This heterogeneity of the formation can’t really be encoded purely in 2D maps, so we need another approach if we need to account for this. Enter 3D modeling
3D modeling
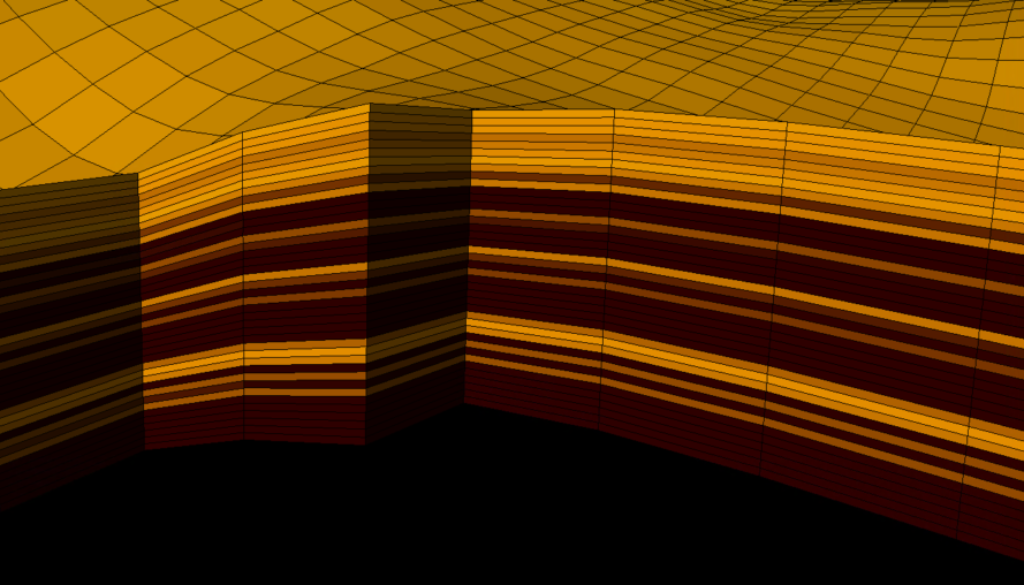
In a 3D geocellular model we use grid cells to hold information about the rock properties they overlap. Cells are arranged by layer, with two horizontal axes (I and J), and a vertical axis (K). Because we are treating the rock formation as a 3 dimensional object, we can also much more easily account for faulting, by locally breaking the grid and sliding it laterally along the fault. While possible to approximate with 2D workflows, it is fairly difficult and time consuming to do so.

In terms of rock properties, instead of averaging log data for an entire zone then gridding it out into a map, we can average well log data on a cell by cell basis, then grid each layer, even providing for some inter-relatability between different layers. All of the tools and algorithms traditionally used in 2D mapping workflows can also be applied within the 3D world, such as minimum curvature, or moving average- We’re just applying them in three dimensions, instead of two.
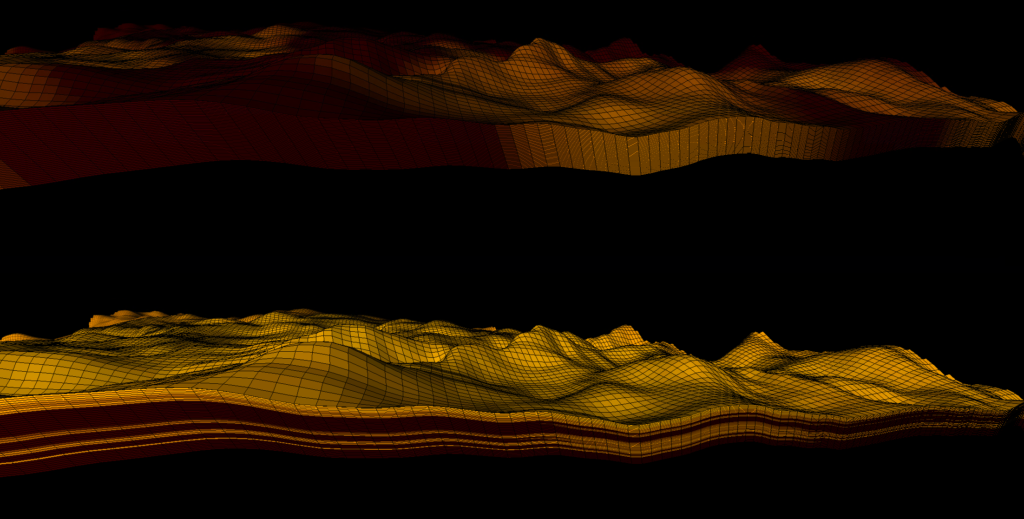
Looking at the porosity property, we can see that we can now characterize vertical heterogeneity. The upper half of the figure above shows our 2D mapping study resampled into 3D space. Notice that we can tell whether certain parts of the formation have higher or lower porosity overall, but that is the extent of it. In contrast, the 3D model on the lower half of the figure is able to show how low and high porosity rocks are inter-fingering within the zone. If we want to predict at which depths we should perforate a new well, the 3D model would far more useful to us.
Discussion
Now there is obviously a LOT I am leaving out here- What about geostatistics? What about permeability and fluid flow simulation? What about structural and fracture modeling, or geomechanical modeling, or the host of other things you can incorporate into a 3D model? Well, we will get there soon enough. After all, that is the point of all this- 3D geocellular modeling is the single best way of integrating data from different disciplines together, and indeed it is the only way to pull all available data together in a single three dimensional framework.
3D geocellular modeling is the single best way of integrating data from different disciplines together, and indeed it is the only way to pull all available data together in a single three dimensional framework.
I mentioned earlier that geomodels are built for purpose. Many times, we are just trying to understand and answer a specific problem- reservoir volumes in oil reservoirs, ground stability and ore body properties in mining applications, or contaminant plume modeling in hydrology for a few examples- and these geomodels can be fairly straightforward to construct. Sometimes however, the purpose of a geomodel is quite expansive, with a goal nothing short of creating a fully integrated, multidisciplinary knowledge base, which can be consumed, adapted and updated as new data become available. These are sometimes termed either Living Earth Models, or Shared Earth Models, depending on the source. These can take some time and a lot of tools to construct, but are infinitely useable, not to mention a beauty to behold.
In my next geomodeling post, I will highlight the three major focus areas in building a geocellular model- Building the deterministic framework, identifying and applying geologic trends, and geostatistical analysis.
Notes:
Project Data used for images derived from- Teapot Dome, Natrona County, WY
This is a non-proprietary dataset sourced from the U.S. Department of Energy
*It is October after all, so just in case you want to own the abomination in the first image, it’s available here. You do you, I won’t judge.
